TinyTroupe from Microsoft
New Microsoft Research project comes with a Python library to create AI agents “for imagination enhancement and business insights”. Ha! This follows Google’s Interactive Simulacra from last year.
TinyTroupe is an experimental Python library that allows the simulation of people with specific personalities, interests, and goals. These artificial agents – TinyPersons – can listen to us and one another, reply back, and go about their lives in simulated TinyWorld environments. […] The focus is thus on understanding human behavior…
So it’s like a little SimCity where AI agents “think” and act (talk). The product recommendation notebook asks the agents to brainstorm AI features for MS Word. It’s a GPT 4 wrapper after all, so the ideas are mediocre at best, focusing on some kind of train/test logic: learn the behavior of the Word user and… (blame the predictive modeling work that dominates the training data)
Are these the most valuable business insights? This project attempts to “understand human behavior”, but can we even run experiments with these agents to simulate the causal links needed for business insights in a counterfactual design? The answer is no: the process, including agent creation and deployment, screams unknown confounders and interference.
It still looks like fun and is worth a try, even though I honestly thought it was a joke at first. That’s because the project, coming from Microsoft Research, has a surprising number of typos everywhere and errors in the Jupyter notebooks (and a borderline funny description):
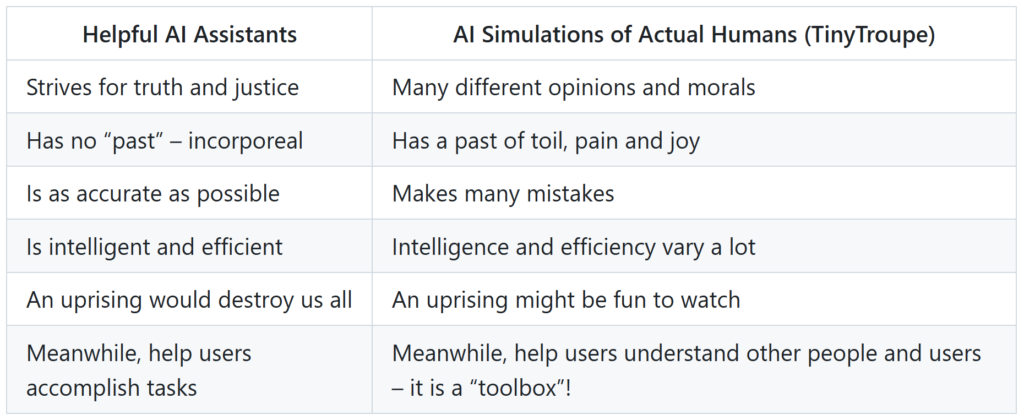
One common source of confusion is to think all such AI agents are meant for assiting humans. How narrow, fellow homosapiens! Have you not considered that perhaps we can simulate artificial people to understand real people? Truly, this is our aim here — TinyTroup is meant to simulate and help understand people! To further clarify this point, consider the following differences: