Passionate Amazon customer service agent (?)

[Click title for image]

You might think Amazon is faking, but another idea is that Ankur is taking the day off after connecting the GPT API to the chat… Or Ankur is a passionate programmer who is willing to help the customer no matter what…

From Reddit.

How to use LLMs for learning in 2025

We can use LLMs to:

  1. Do things
  2. Learn things

When just doing things, LLMs feel like magic. Not so much when learning.

LLMs are excellent tools for getting things done: writing, rewriting, coding, code reviewing, or just figuring things out. The interaction to get things done is straightforward, but it can be improved if the goal is not just to get things done, but to get things done right. For example:

  • You can use an LLM that reports sources in addition to answers. Click on some of the sources to understand the context of the answer. This will help you verify that the answer is within the bounds of what you’d expect. It will also help you validate the answer against the source.
  • Pause and review the autocompleted code to make sure it does what it is supposed to do. If it doesn’t look familiar, just copy and paste the main function and use good old Google.

When it comes to learning, things get more complicated. With the latest round of updates (Claude 3.5, GPT o1 etc.), LLMs have taken over the chain of reasoning for many tasks.

This means that you don’t have to think about the question and formulate the steps of a solution yourself, the model does that for you. The model gives you a fish, but you don’t really learn where the fish came from. Instead, you can:

  • Embrace your own chain of thought: For topics and tasks where your goal is not just to do things, but to learn how to do them, keep your train of thought to yourself. This means proactively thinking of answers to the question at hand before you ask LLM your question.
  • Treat post-LLM agents as assistants that need guidance in thinking and reasoning. Think of a solution first, and ask the agent to help you through the steps of the solution. The agent may come up with a different solution, and that’s okay. Just try to understand why.
  • A quick tip. Using search and discovery focused LLM tools like Perplexity can help this process. Perplexity’s “Pro Search” and “Focus” motivate the learner to be more proactive.

I gave another talk in December and updated my main deck on Knowing vs. Understanding. You can find it here. For my December talk, I also put together a prologue deck for this discussion, which I will post after optimizing it for the web. Stay tuned.

Modeling data to win an argument or solve a problem

Modeling data to win an argument motivates us to make assumptions that are often baked into the modeling process.

There is a better way: focus on solving the problem. It starts with “I don’t know”, and it takes creativity and an open mind to find out. The data may or may not be there. We may need an experiment to get the data. The method we use to model the data doesn’t matter anymore. Methods become tools. More importantly, focusing on solving the problem limits our assumptions to those we have to make to get from the data to a model for decision making. So we focus on data centricity.

The pleasure of winning an argument will always be there, but perhaps we can avoid it in favor of better decision making and problem solving. And even if we can’t avoid it, we’re probably better off making an argument to learn, not to win.

Model Context Protocol for LLMs

LLM news never stops these days, but this could be a big one from a development perspective. MCP is an open standard protocol for connecting LLMs to any data source, removing the custom development barrier for LLMs to securely work with private data as directed.

For example, Claude Desktop can now use MCP to connect to, query, and analyze data in a local SQL database, keeping the data private and secure without integration barriers.

In the video, Claude is asked to develop an HTML page, create a GitHub repo to push the page to, push an update, create an issue, push changes, and create a pull request.

The protocol won’t be as visible to end users, but it will open up many possibilities for LLM agents, essentially lowering the cost of agent creation and data access.

Cool, here.

1 dataset 100 visualizations

Nice thought experiment and execution on many visualizations of the same data: change in the number of World Heritage sites from 2004 to 2022 in three Nordic countries.

Clearly, the data is better presented here as a table with a third row/column showing percentages, as shown on the About page, but getting to 100 certainly takes some creativity.

Source

Modern macro recording

Remember the ability to “record” Excel macros we were promised back in the 90s that never quite worked? Autotab now does that job as a standalone browser.

It’s basically automation on steroids, making the training and execution of a mini-model easier and more accessible, eliminating the tedious process for everyday tasks.

This is a great use case for the post-LLM world of AI agents, with a potentially direct positive impact on employee productivity and net value creation. Check it out here.

Quantification bias in decisions

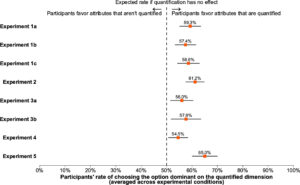
When making decisions, people are systematically biased to favor options that dominate on quantified dimensions.*

The figures show the extent of bias in different contexts. Depending on what information is quantified, our decisions change even though the information content remains about the same. In other words, quantification has a distorting effect on decision making.

This made me think about the implications for data centricity. By prioritizing quantitative over qualitative information, are we failing to stay true to the data?

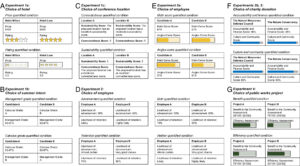
The study provides some evidence: we overweight salary and benefits and overlook work-life balance and workplace culture in our decisions. We check product ratings but miss the fact that the product lacks that one little feature we really need. It’s discussed in product reviews, but not quantified.

That sounds right. Clearly, we often base our decision to stay at a hotel on the rating rather than the sentiment in the reviews. But will this tendency change? Quite possibly. We have LLMs everywhere. LLMs can help resolve the trade-off between quantification and data centricity.

Using text data for decision making is easier than ever. We can now more effectively search in product reviews instead of relying solely on ratings (e.g. Amazon Rufus). Information about work-life balance and workplace culture contained in employee reviews can be more effectively quantified. Currently, Glassdoor applies sentiment analysis to a subset of work-life balance reviews by keyword matching, but it’ll get better. Comparably.com already does better.

It’s time to do better. LLMs offer the opportunity to use qualitative information for more effective, higher quality decisions by staying true to data, or data centricity.

* From the article Does counting change what counts? Quantification fixation biases decision-making.

H/T Philip Rocco for sharing the article. You can learn more about data centricity at datacentricity.org.

TinyTroupe from Microsoft

New Microsoft Research project comes with a Python library to create AI agents “for imagination enhancement and business insights”. Ha! This follows Google’s Interactive Simulacra from last year.

TinyTroupe is an experimental Python library that allows the simulation of people with specific personalities, interests, and goals. These artificial agents – TinyPersons – can listen to us and one another, reply back, and go about their lives in simulated TinyWorld environments. […] The focus is thus on understanding human behavior…

So it’s like a little SimCity where AI agents “think” and act (talk). The product recommendation notebook asks the agents to brainstorm AI features for MS Word. It’s a GPT 4 wrapper after all, so the ideas are mediocre at best, focusing on some kind of train/test logic: learn the behavior of the Word user and… (blame the predictive modeling work that dominates the training data)

Are these the most valuable business insights? This project attempts to “understand human behavior”, but can we even run experiments with these agents to simulate the causal links needed for business insights in a counterfactual design? The answer is no: the process, including agent creation and deployment, screams unknown confounders and interference.

It still looks like fun and is worth a try, even though I honestly thought it was a joke at first. That’s because the project, coming from Microsoft Research, has a surprising number of typos everywhere and errors in the Jupyter notebooks (and a borderline funny description):

One common source of confusion is to think all such AI agents are meant for assiting humans. How narrow, fellow homosapiens! Have you not considered that perhaps we can simulate artificial people to understand real people? Truly, this is our aim here — TinyTroup is meant to simulate and help understand people! To further clarify this point, consider the following differences:

Source

AI outlines in Scholar PDF Reader

Google’s PDF Reader seems to have got a new feature:

An AI outline is an extended table of contents for the paper. It includes a few bullets for each key section. Skim the outline for a quick overview. Click on a bullet to deep read where it gets interesting – be it methods, results, discussion, or specific details.

Clearly it’s not an alternative to reading (well, I hope not), but it makes search and discovery a breeze. Sure, one could feed the PDF into another LLM to generate a table of contents and outline, but the value here is the convenience of having them generated right when you open the PDF (not just in Google Scholar, but anywhere on the web). Highly recommended.

If you’re not already using this tool, I shared this very, very helpful tool when it came out earlier this year.

New chapter in the Causal Book: IV the Bayesian way

New chapter in the Causal Book is out: IV the Bayesian Way. In this chapter we examine the price elasticity of demand for cigarettes and identify the causal treatment effect using state taxes as an instrument. We’ll streamline the conceptual model and data across chapters later.

Basically, the sample question here is: What is the effect of a price increase on smoking? As always, the solution includes complete code and data. This chapter uses the powerful RStan and CmdStanR via brms and ulam, and, unlike the other chapters, doesn’t replicate the solution in Python (due to the added computational cost of the sampling process).

Causal Book is an interactive resource that presents a network of concepts and methods for causal inference. Due to the nonlinear – network structure of the book, each new chapter comes with a number of other linked sections and pages. All of this added content can be viewed in the graph view (available only on desktop in the upper right corner).

This book aims to be a curated set of design patterns for causal inference and the application of each pattern using a variety of methods in three approaches: Statistics (narrowly defined), Machine Learning, and Bayesian. Each design pattern is supported by business cases that use the pattern. Three approaches are compared using the same data and model. The book discusses the lesser known and understood details of the modeling process in each pattern.